Experimental Determination of Fatigue Crack Closure in 316 N Weld Using a Global CMOD Method
Experimental Determination of Fatigue Crack Closure in 316 N Weld Using a Global CMOD Method
ABSTRACT: The crack closure phenomenon is important in order to assess the fatigue crack growth. Hence, the accurate measurement of the opening load of the crack is essential for the determination of the effective stress intensity factor range Keff. The crack opening or closing point is commonly measured from load-displacement or load-differential displacement records. In spite of much effort devoted to the measurement and interpretation of closure, there seems to be no accurate method for evaluating the crack closure loads. This paper describes a “global crack mouth opening displacement” GCMOD method for the measurement of crack opening load on CT specimens. The crack opening load was determined from the change in the slope of the load versus displacement curve and is used to characterize closure loads in 316 N austenitic stainless steel weld at different a/W ratios during fatigue testing. A good correlation was obtained for Keff/K=−0.265 a/W+0.590 for R=0.1 in the range 0.35 a/W0.55. The loading-unloading hysteresis is clearly observed. Experimental results indicate that the closure load is almost independent of the crack lengths.
KEYWORDS: fatigue crack growth, crack closure, GCMOD, 316 N weld, compact tension specimens
Introduction
The phenomenon of plasticity-induced closure was first proposed and investigated by Elber 1, and led to new concepts in fatigue crack growth. During loading, large tensile strains are developed near the crack tip, which are not fully reversed upon unloading as the crack extends. Closure is important because it tends to alter the relationship between the applied stress intensity range K and that actually experienced by the crack tip. Under constant ampli- tude loading, crack closure tends to decrease the applied stress in- tensity, resulting in a corresponding reduction in crack growth rate. Subsequently, the effective stress intensity factor SIF range, Keff, defined as 1
where Kmax and Kop are the SIF associated with the maximum load, Pmax, and an opening load, Pop, respectively. Equation 1 implies that only the load above Pop would affect crack tip damage during the loading cycle. Besides Pop, it is also possible to define closing load, Pcl, corresponding to the load required to close the crack during unloading. It should be pointed out that Pop and Pcl can be different and thus a hysteresis exists.
In general, experimental techniques used for crack closure or crack opening determination fall into two categories, i.e., direct and indirect methods. The direct techniques include the following: op- tical and scanning electron microscopy observations 2–4, photog- raphy 5, optical and laser interferometry 6–8, surface strain 9,10 and caustics 11. Up until now, there is no direct experimen- tal method for metallic materials that is capable of measuring the actual development of through-thickness crack closure. The most common indirect techniques, which utilized the compliance curve are: back face strain BFS 12, crack mouth opening displace- ment CMOD 13–15, and near-crack tip gage NCTG 16,17 measurements. In addition, other methods such as acoustic emis- sion AE 18, eddy current 19, potential drop PD 20, and dynamic compliance 14 are also used.
In most cases the crack closure level is measured by compliance method by means of a clip gage displacement at the crack mouth a CMOD technique as is done in Ref. 1. It is then a question if these methods are sufficiently sensitive to monitor the closure level. If the difference in slope between open and closed crack is too small, the open part of the load cycle may be too small for accurate slope measurements and the opening may occur in such a gradual way to make linear fittings uncertain. In the gradual crack closure Manuscript received July 16, 2004; accepted for publication August 23, 2005; published online December 2005. 1 Materials and Metallurgy Group, Indira Gandhi Centre for Atomic Research, Kalpakkam, India. Fax: 0091-44-27480075, e-mail: johan@igcar.ernet.in
event, the problem revolves around the identification of this point. As a result, the 2 % offset method was then adopted into the ASTM standard E 647 recommendation 21. The use of 2 % offset crite- rion in the compliance offset opening load analysis method pro- duced relatively low scatter in opening load values. In RCC-MR- SEC I 22, crack opening load level was evaluated through interpretation of the load-differential displacement traces to detect a meaningful change in slope, which was then referred to as the opening load, Pop. Therefore, in the event of fatigue crack closure,
the relationship between the applied load and COD should be nearly bilinear. The point of slope change will correspond to the transition of the fatigue crack from the “open” to “closed” state or vice versa. When the load-displacement keeps decreasing with un- loading, then the closure can only be local and its contribution is much smaller than is generally assumed. In this work, a “GCMOD” method using a displacement gage is used to attain the load- displacement curve. A fatigue crack was incrementally grown at a constant Kmax and R. The crack opening behavior was evaluated at different crack lengths using the GCMOD method.
Experimental
Materials and Experiments
The material used for this investigation is an AISI 316 N type austenitic stainless steel weld. This material is widely used in nuclear power plant structural components. For the fatigue crack closure load determination, ASTM compact tension CT speci- mens with notch in the weld, having a width, W, of 40 mm and a thickness, B, of 9.7 mm were prepared 21.
Prior to the actual fatigue testing, the specimen is precracked at room temperature at constant load levels, constant R=0.1 condi- tions and below the test load. The specimens were fatigue cycled on a 100 kN servo-hydraulic fatigue testing machine using load as the control parameter. The cyclic frequency, cyclic stress ratio, test
temperature, and the loading waveform were held constant for all tests: the frequency was 20 Hz, the stress ratio R was 0.1, test tem- perature was 27°C and a sinusoidal loading waveform was used. The crack length was monitored using Krak gages@ with a resolu- tion of 0.01 mm.
Crack Opening Displacement COD Determination
Using Displacement Gage Technique
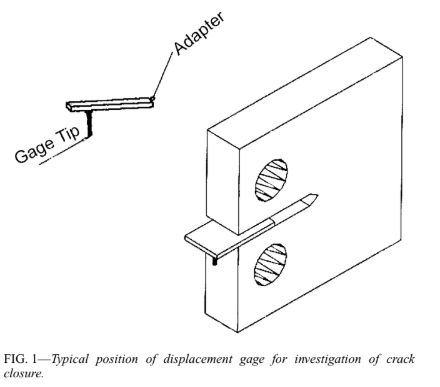
Experimental determination of the opening load, Pop, needed in Eq 1, is inferred from the global crack mouth opening displacement GCMOD as a function of the applied load using an EPSILON® model 3540 deflection gage. In the Paris regime, crack growth was interrupted and crack-opening force was measured for different normalized crack lengths a/W=0.35 to 0.55 at R=0.1. For an in situ measurement, the transducer assembly is mounted at a distance of 5 mm this distance is not mandatory on an extended adapter from the notch mouth called global, and the schematic is shown in
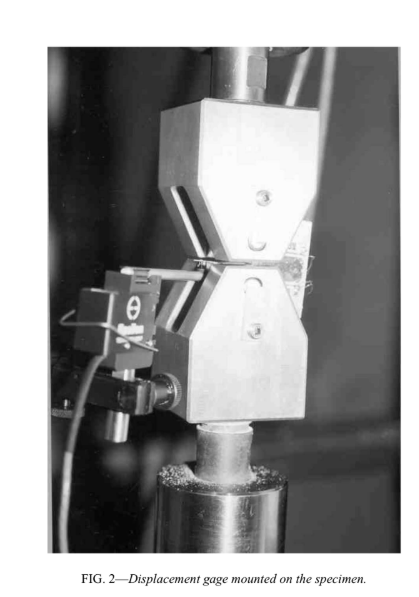
Fig. 1. This is because a location too close to the crack tip might lead to misleading results. Deflection is measured with a single arm, with a spherical contact tip. To avoid false hysteresis in the load-displacement curve, this spherical tip is allowed to sit firmly on a machined dent in the adapter. This proved to be easy to use and an effective mounting scheme. The resolution of this measurement technique is 1 μm. The loading frequency was reduced to 0.025 Hz during the closure measurement for a higher signal to noise ratio. A photograph of the displacement gage and its mounting is shown in
Fig. 2. Crack opening load level was then evaluated following RCC-MR-SEC I 22 through interpretation of the load-differential displacement traces.
Results
Crack Opening Load Determination
For consistency in comparison of the results, opening loads were selected from all data. The trends of the results and conclusions would be similar for closure loads.
where =a/W; this expression is valid for a/W0.2. To a first approximation the stress state at the crack tip for P Pop is given by the effective stress intensity factor Keff=Kmax −Kop 1. It was then assumed that the crack propagation rate was solely a function of Keff, that is, the SIF range that the crack tip was open. To present the results a value U is generally used 1:
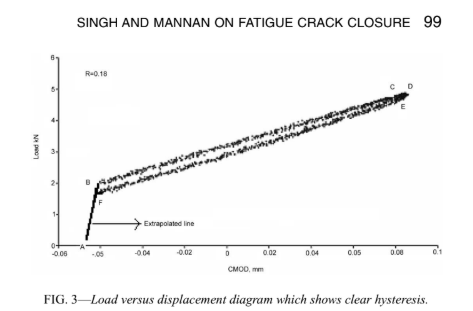
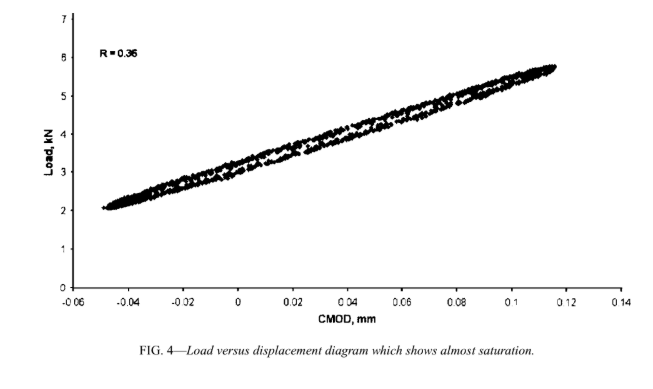
To investigate the existence of the crack opening-closure hyster- esis, tests were performed for two R-ratios at constant Kmax. Typical load versus displacement curves for R=0.18 and 0.36 are given in
Fig. 3 after extrapolating the initial opening and final closing phases and Fig. 4, respectively. The small hysteresis loop during crack opening and closing observed seems associated with the length of the open part of the crack relative to the size of the plastic zone. The following observations are found in Fig. 3:
1. The initial portion A-B represents the crack opening phase.
2. The linear region B-C represents where the crack tip is completely open and the influence of crack tip plasticity on the elastic response of the specimen is negligible.
3. The last nonlinear region C-D represents the loading phase where plastic deformation ahead of the crack tip dominates.
4. Similarly, in the unloading phase the first nonlinear seg-
ment D-E represents the plastic deformation ahead of the crack tip dominates.
5. The second linear portion E-F represents the elastic re-sponse of the fully open crack. The load versus displacement curve in Fig. 4 is almost linear in loading and unloading which shows near-saturation at almost fully opened crack.
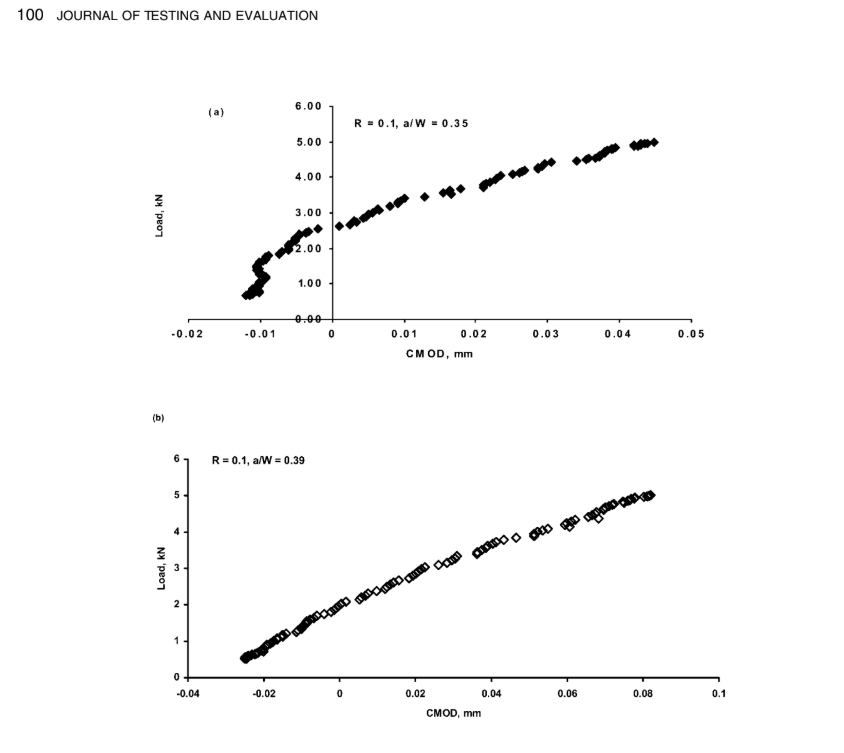
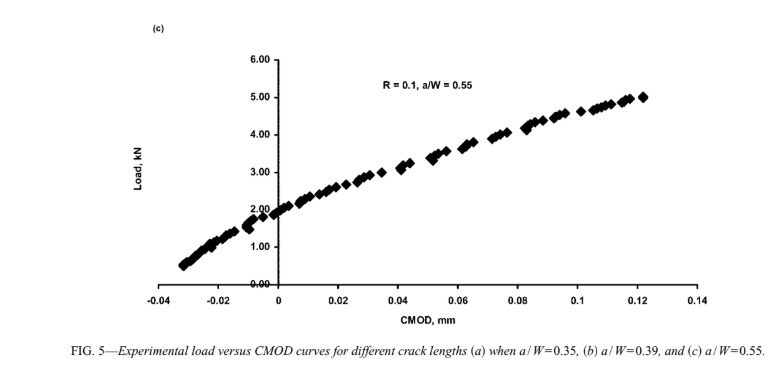
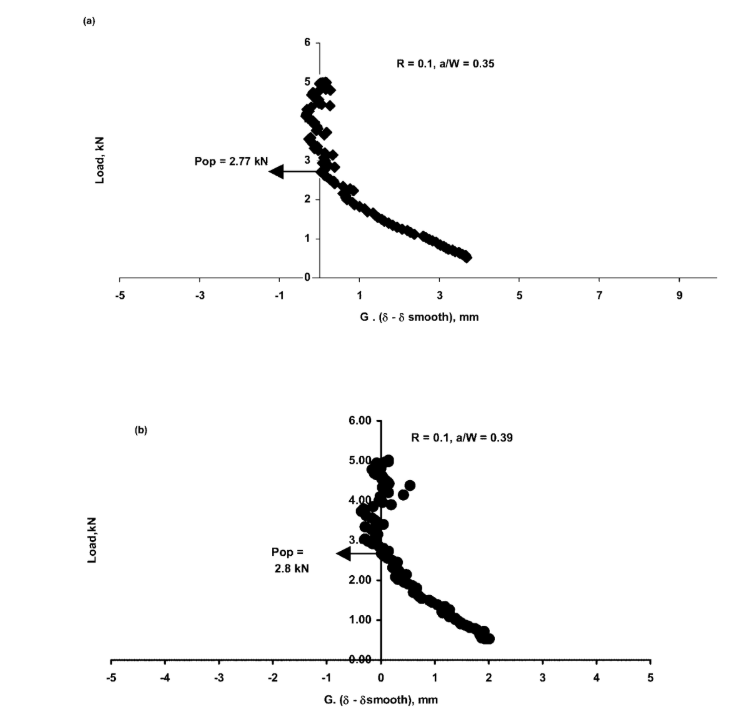
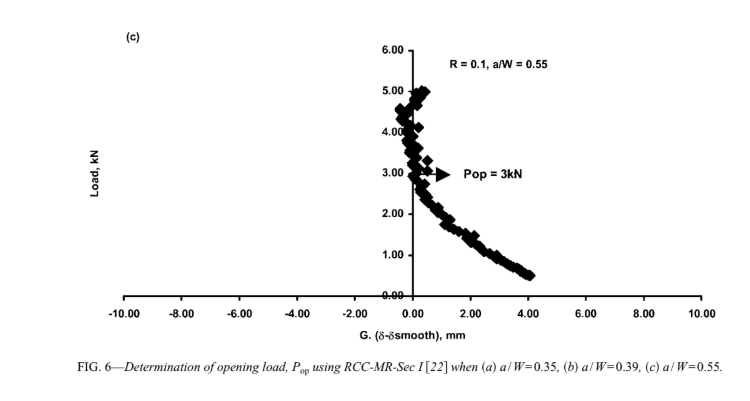
The load-displacement curves obtained for different a/W ratios are presented in Figs. 5a–5c. A discontinuity in the slope of a load-displacement plot corresponding to a crack opening has been reported in the literature 6,9,10. In most cases, the slope change is gradual and the crack closure load is measured from load- differential displacement plot 22. At low a/W values, the slope change was near to abrupt. However, as the a/W value was in- creased, the slope change was gradual. In this analysis, the precise crack opening force is determined following the RCC-MR-SEC-I 22 procedure by plotting the curve of load as a function of differ- ential displacement −smooth. The gain factor G is 100. The re- sults after analysis are shown in Fig. 6 for various a/W ratios in the range 0.35 to 0.55. According to the recommendation 22, all the experimental points corresponding to crack opening align on a ver- tical line. Thus the change in linearity is amplified and the load at the transition point can be interpreted as the opening load, Pop.
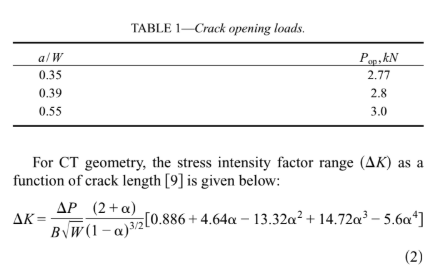
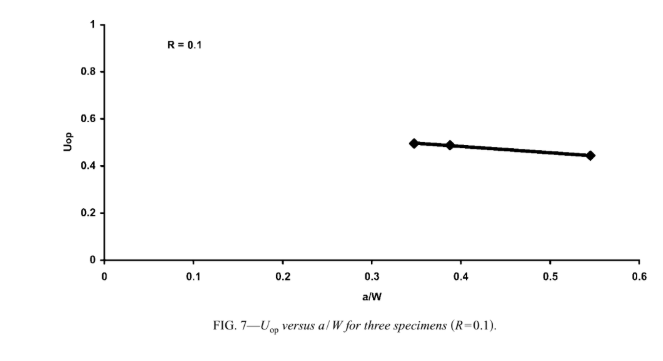
The Kop is determined from Pop using Eq 2 and hence of Uop using Eq 3. The Pop determined for different a/W ratios are given in Table 1. In Fig. 7, Uop is plotted against a/W ratios in the range of 0.35a/W0.55, where the change of Uop is small. It was found that Uop is almost independent of Kmax. A reasonable correlation between Uop and a/W was obtained. If a linear relationship between Uop and a/W is assumed, then for this specimen the following rela- tionship is valid.
Conclusions
1. The objective of this study was to evaluate Pop, as defined by Elber as the point of linearity on the load-displacement relation, as the parameter to quantify the load at which a crack is completely open.
2. In this analysis, a global CMOD technique using displace- ment type gage is used for determining Pop.
3. The results of the data presented indicate that Uop is almost independent of a/W ratios.
References
1 Elber, W., “The Significance of Fatigue Crack Closure. Dam- age Tolerance in Aircraft Structures,” ASTM STP 486, ASTM International, West Conshohocken, PA, 1971, 230–242.
2 Xu, Y., Gregson, P. J., and Sinclair, I., “Systematic Assess- ment and Validation of Compliance-Based Crack Closure Measurements in Fatigue,” Mater. Sci. Eng., A, Vol. 284, 2000, pp. 114–125.
3 Jono, M., “SEM and AFM Observation and Mechanism of Fa- tigue Crack Growth,” Fatigue ’99: Proceedings of the 7th In- ternational Fatigue Congress, Beijing, China, 1999, 57–68.
4 Davidson, D. L., “Fatigue Crack Closure,” Eng. Fract. Mech., Vol. 38, 1991, pp. 393–402.
5 Riddell, W. T., Piascik, R. S., Sutton, M. A., Zhao, W., Mc- Neill, S. R., and Helm, J. D., “Advances in Fatigue Crack Clo- sure, Measurement and Analysis,” ASTM STP 1343, ASTM International, West Conshohocken, PA, Vol. 2, 1999, pp. 157– 174.
6 Sharpe, W. N., Jr., Jira, J. R., and Larsen, J. M., “Small Crack Test Methods,” ASTM STP 1149, ASTM International, West Conshohocken, PA, 1992, pp. 92–115.
7 Li, K., “The Interferometric Strain Rosette Technique,” Exp. Mech., Vol. 36, 1996, pp. 199–203.
8 Li, K., “Out of Plane Displacement Derivative Measurements Using Interferometric Strain/Slope Gage,” ASME J. Appl. Mech., Vol. 63, 1996, pp. 1033–1038.
9 Tsukuda, H., Ogiyama, H., and Shiraishi, T., “Fatigue Crack Growth and Crack Closure at High Stress Ratios,” Fatigue Fract. Eng. Mater. Struct., Vol. 18, 1995, pp. 503–514.
10 Lang, M. and Huang, X., “The Influence of Compressive Loads on Fatigue Crack Propagation,” Fatigue Fract. Eng. Mater. Struct., Vol. 21, 1998, pp. 65–83.
11 Wallhead, I. R., Edwards, L., and Poole, P., “A Study of Crack Closure Using the Optical Method of Caustics and Conse- quences for the Use of Keff as a Fatigue Crack Driving Force,” Eng. Fract. Mech., Vol. 60, 1998, pp. 291–302.
12 Lee, C. S., Park, C. G., and Chang, Y. M., “Precise Determi- nation of Fatigue Crack Closure in Al Alloys,” Mater. Sci. Eng., A, Vol. A216, 1996, pp. 131–138.
13 Hertzberg, R. W., Newton, C. H., and Jaccard, R., “Crack Closure-Correlation and Confusion, Mechanics of Fatigue Crack Closure,” ASTM STP 982, ASTM International, West Conshohocken, PA, 1998, pp. 139–148.
14 Sarma, V. S., Jaeger, G., and Koethe, A., “On the Comparison of Crack Closure Evaluation Using Dynamic and Static Com- pliance Measurements,” Int. J. Fatigue, Vol. 23, 2001, pp. 741–745.
15 Seetharam, S. and Dash, P., “Load-CMOD Data Analysis for Crack Closure,” Int. J. Fatigue, Vol. 53, 1992, pp. R53–R58.
16 Oh, C. S., Earmme, Y. Y., and Song, J. H., “Automated Real- Time Measurements of Fatigue Crack Length and Crack Opening Load Using Unloading Compliance Method,” Int. J. Fatigue, Vol. 19, 1997, pp. 169–176.
17 Kim, C. Y. and Song, J. H., “An Automated Procedure for De- termining Crack Opening Level from Differential Displace- ment Signal Data,” Int. J. Fatigue, Vol. 15, 1993, pp. 301–309.
18 Berkovits, A. and Fang, D., “Study of Fatigue Crack Charac- teristics by Acoustic Emission,” Eng. Fract. Mech., Vol. 51, 1995, pp. 401–416.
19 Burke, S., “Eddy-Current Inversion in the Thin-Skin Limit: Determination of Depth and Opening for a Long Crack,” J. Appl. Phys., Vol. 76, 1994, pp. 3072–3080.
20 VanStone, R. H. and Richardson, T. L., “Potential Drop Moni- toring of Cracks in Surface-Flawed Specimens, Automated Test Methods for Fracture and Fatigue Crack Growth,” ASTM STP 877, ASTM International, West Conshohocken, PA, 1985, pp. 148–166.
21 ASTM E 647, “Standard Test Method for Measurement of Fa- tigue Crack Growth Rates,” ASTM International, West Con- shohocken, PA, 2000.
22 RCC-MR, Design and Construction Rules for Mechanical Components of FBR Nuclear Islands, 2002, Section I, Sub- section Z, Technical appendix A16.