Creep crack initiation and growth in AISI 316 (N) weld – FEM and experiments
Creep crack initiation and growth in AISI 316 (N) weld – FEM and experiments

ABSTRACT
There are two aspects of the creep crack growth behaviour, namely, the crack initiation and the crack propagation. An incubation period is often observed prior to the onset of creep crack growth. In this study, creep crack initiation and propagation in pre-cracked compact tension (CT) specimens of a 316 (N) stainless steel weld at T 1⁄4 550 and 625C under static loading is investigated. Both the crack initiation time and the crack growth rate are measured as a function of fracture parameter C*. It is shown that it is possible to correlate the creep crack initiation time with the C* parameter. It is also shown that the creep crack growth rate can be correlated with the C* integral. Additionally, finite element analyses by using the ANSYS software have been performed at one test condition (T 1⁄4 625C) in order to estimate numerically the crack mouth opening displacement rate history for a propagating crack using the node release technique. When the FEM results are compared with the experimental data, the results show a very satisfactory prediction capability.
Keywords: creep crack initiation, crack growth, 316 (N) weld, compact tension specimens
1. INTRODUCTION
Type 316L(N) is a candidate structural material for use in the sodium cooled pool type fast breeder reactor (FBR) [1] under construction at Kalpakkam. The behaviour of crack like defects in components operating at high temperature where creep is significant is of interest in this plant. The operational and plant assessment experience indicates thatin the majority of cases where creep crack initiation andgrowth occurs, defects often originate in welds. Thegrowing need to extend the service life of high temperature components requires a quantification of the material and design parameters. It is essential that the procedures are reliable and sufficiently conservative. Global approach in fracture mechanics is used for creep crack initiation and creep crack growth estimation [2]. For each geometry and loading condition, a global parameter is computed and then used in an empirical correlation for crack initiation or crack growth assessment. For instance, a correlation between time and C* for creep crack initiation estimation on the one hand or between crack growth rate and C* for creep crack growth assessment on the other hand, can be made. Most methods of describing creep crack growth employ fracture mechanics concepts [3,4]. The terms that have been used for characterizing crack propagation rates include stress intensity factor K and the creep fracture mechanics para- meters Ct, C(t) and C* depending on the extent of creep deformation encountered. Generally the applicability of K is restricted to extremely brittle circumstances where elastic strains dominate. In contrast, Ct and C(t) are most suitable for situations involving small scale creep and C* to more extensive creep conditions. Most success in applying the concepts has been achieved when crack growth is well established. In these circumstances the creep crack propa- gation rate daydt can usually be described in terms of C* by an expression of the form
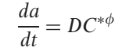
where D and f are material dependent parameters which can be obtained experimentally or from the models of the cracking process [5].
However, often an initiation period is observed prior to the onset of crack growth [6 – 8]. It is apparent that it can occupy a significant proportion of the failure life. Consequently, account must be taken of this period if accurate predictions of crack extension are to be obtained. The life of such a structure may therefore be regarded as comprising two components:
where ti is the time to initiate a creep crack and tg is the time to grow the crack to rupture.
The limit of reliable crack detection is at best 0.2 mm (which is the level set for standard CT testing in ASTM E1457-00) [9] and can sometimes be as large as 0.5 mm [10].
The purpose of this work is to propose a simplified method based on the C* parameter for creep crack initiation and creep crack growth assessment in welded structure. Experimental methods are employed to calculate C* [9]. To complement the testing, numerical computations can also be used to study the creep deformation parameters. The numerical study done here is to measure the crack mouth opening displacement following the same approach as that used in the experiment.
1.1 Fracture parameters
For cracked bodies deforming under steady-state creep conditions (or power-law creep), equation (1), the crack-tip stress and strain rates are uniquely characterized by the C*- integral, as shown by several researchers [4,11]. The C* integral [ASTM E1457 00] for the CT type specimen is given by
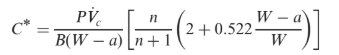
where P is the load,V_c is the load-line deflection rate due to creep, n is the creep exponent, W is the width of the specimen, a is the crack size and B is the specimen thickness. The load-line deflection rate due to creep in equation (3) is obtained from the measured load-line deflection rate (V_ ) as follows [ASTM E1457-00]:
where E is the elastic modulus,Jp
is the fully plastic component of the J integral [ASTM E1457-00] and m is the stress exponent in the Ramberg-Osgood stress-strain relationship. Parameters m and n are deduced from the RCC-MR database [12].
1.2 Validity criteria
Equation (4) is valid when the effects of the growing crack on the crack-tip stress fields are negligible. Thus the following validity criteria were satisfied for the data to be considered valid. Only data for which the transition time, tT , was satisfied are taken for valid.

The data that meet the displacement rate requirement of V_
c</p><p>V_ 0:5
are considered valid. The crack growth data obtained prior to the first 0.5 mm crack extension that may be transient creep crack growth is identified separately.
1.3 Crack initiation
In materials with high creep ductility, initiation represents a significant part of life. Therefore, an attempt was made to determine the initiation time. Prior to the onset of steady state creep crack growth that is described by equation (1), usually an incubation period is observed during which damage builds up at the crack tip [13]. In the primary part of the curve crack length (a) versus time (t), blunting of the crack tip mostly produces crack elongation. During this period, transient conditions exist which are not uniquely defined by C*. The duration of this period is determined to some extent by the resolution of the crack monitoring equipment used to detect it. Typically, this corresponds to a crack extension Da of between 0.1 and 0.5 mm depending on component size and shape. ASTM E1457-00 identifies an extension of 0.2 mm for tests on CT specimens to cover the entire transition time to steady state conditions. In this study an extension of 0.5 mm is adopted as crack initiation and this is associated to the first value of ‘a’ after loading. From equation (1) it may be expected that the time ti to initiate an extension of Da is given by an expression of the form
where k and a are material constants. Equations (1) and (6) can be used in conjunction with equation (3) to make predictions of creep crack initiation and creep crack growth.
Creep crack initiation and growth in AISI 316 (N) weld – FEM and experiments: P. Johan Singh et al.
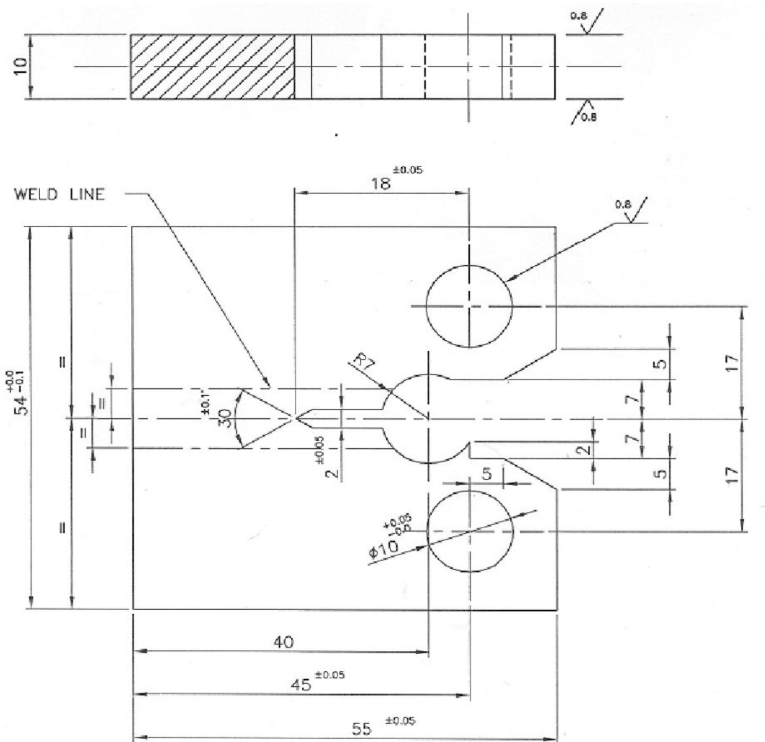
Figure 1 C(T) Specimen geometry and dimensions.
2. EXPERIMENTAL
2.1 Sample preparation
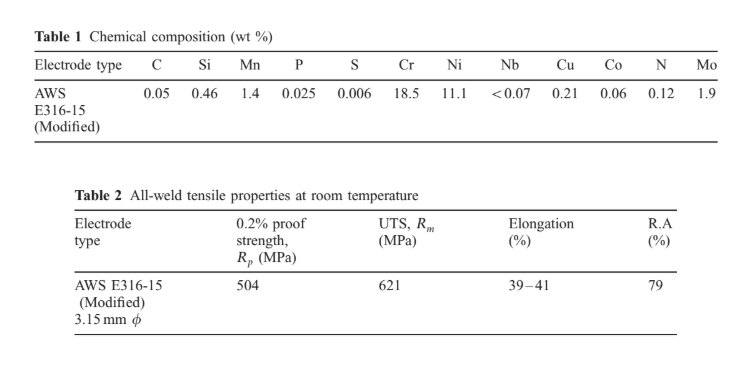
The material chosen for this investigation is an AISI 316L(N) type austenitic stainless steel. Welds were produced using a manual metal arc welding (MMAW) process with 316 (N) filler following a qualified procedure in accordance to section IV of the RCC-MR code [14]. After welding the joint was successfully subjected to the typical ASME IX [15] qualification. The notch was placed in the center of the fusion zone and the crack propagation is parallel to welding and rolling direction. The chemical composition and mechanical properties of this material and filler are shown in Table 1 and Table 2 respectively. ASTM ‘‘compact tension specimens’’ were utilized in the crack growth tests
[9]. The specimen configuration and dimensions are shown in Figure 1. The notch was placed in the center of the fusion zone and crack propagation was along the welding direction.
2.2 Creep crack growth testing
Two experimental approaches can be used to determine the creep crack behaviour (creep crack initiation and creep crack growth):
1. Interrupted test method (ITM) and
2. Continuous test method (CTM).
The CTM method needs one specimen in order to describe creep crack behaviour for one stress level, therefore it is called ‘‘single specimen method’’. During the tests, contin- uous online measurement of the load line displacement and crack growth is performed. Uniaxial creep crack growth testswere conducted at T 1⁄4 550 and 625C in accordance with specifications outlined in ASTM E 1457-00 [9]. Temperature was maintained to within +1C of testing temperature. Prior to testing, all specimens were fatigue pre-cracked at room temperature at constant load levels, constant R 1⁄4 0:1 conditions and below the creep crack growth test load. Load
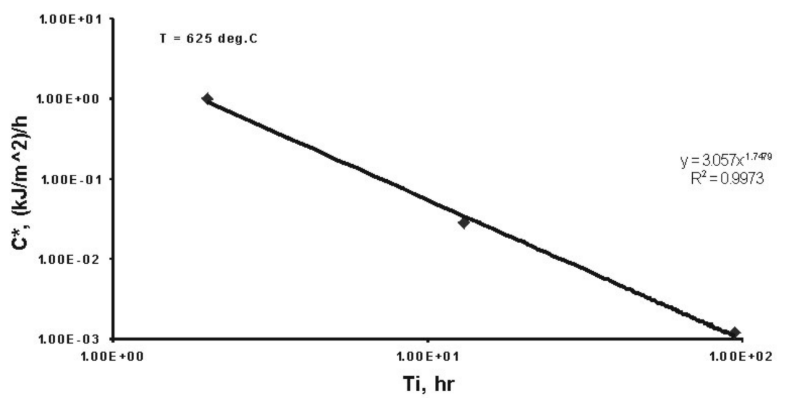
Figure 2 Correlation between time to initiation and the loading geometry parameter, C* when d 1⁄4 0.5 mm.
line displacements V(t) were measured using a quartz rod type COD gauge attached to the specimens. Crack lengths a(t) were measured by the DC potential drop technique. A pulsed DCPD system of Matelect was used in all testing. For the determination of crack length from the measured potential, the initial and final potential drop values with the initial and final crack lengths measured from the fractured specimens and converted all intermediate values by linear interpolation. The creep crack growth rate, daydt, was calculated by directly dividing the increment of crack length, Da, by the increment in time, Dt. Similar calculations were also done in the case of load line displacement rate dV/dt.
Tests for characterizing the creep crack initiation were made at T 1⁄4 625C at various load levels. The initiation time ti was determined from aðtÞ data, as the time necessary for the crack to grow from the initial crack front over a critical distance (d = 0.5 mm).
3. RESULTS AND DISCUSSION
3.1 Initiation behaviour at
T 1⁄4 6258C using ti C* method
The global approach of fracture mechanics for creeping solids correlates ti with loading parameters such as Ch* or C* for primary or secondary creep respectively [16]. For 316L(N) stainless steel, much work has been done in this way [13]. The results for creep crack initiation behaviour in Figure 2 show that the creep crack initiation time in type 316 (N) weld at 625C correlates well with the C* integral. Figure 2 also includes an empirical expression corresponds to equation (6) relating C* and ti:
where the fitting constants a and k is for d 1⁄4 0.5 mm. C* is in kJym2 h and ti is in hours. This result is in good agreement with the values evaluated by Mass and Pineau [17] who found from their tests on 316L stainless steel that it is possible to relate uniquely ti and the initial value of C*.
3.2 Creep crack propagation at T 1⁄4 550 and 625C
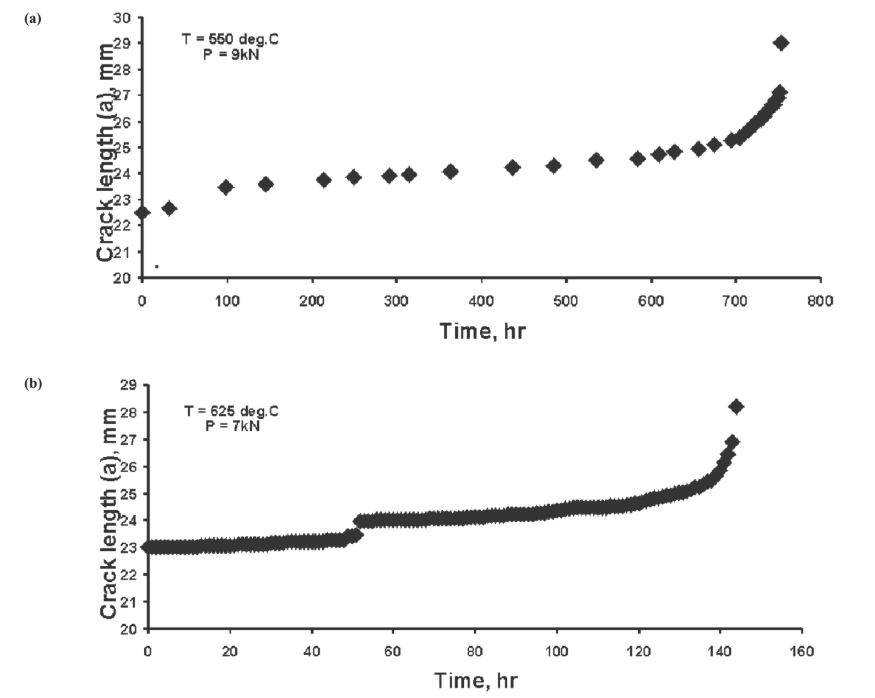
The creep crack growth tests were analyzed with the C* concept following ASTM E1457-00. Figures 3 and 4 show the crack length (a) and deflection (V) versus time (t) data obtained from two typical creep crack growth tests. In order to ensure that the specimens were in fact under extensive creep conditions, Riedel –Rice transition time, tT (equation (5), was calculated for all the specimens and compared with the test times (Figure 5). In all cases the test times were several times larger than the transition times, indicating that the tests were almost entirely in the extensive creep regime. Instead of plotting the a(t)-curves, the crack growth data can be plotted as crack growth rate, a_, versus load parameter, C*. The rate ratio criterion for both V_
c</p><p>V_ 0:8 and V_
c</p><p>V_ 0:5
conditions is also calculated and shown in Figure 6. The
points adopted in this analysis are those for which the ratio
V_
c
V_ between the opening rate due to creep and the total
opening rate measured is greater than 0.5. In Figure 7, the
a C_ * -relationship is shown and this is the best data fit of
creep crack growth rate correlated with C* for this material.
The best-fit data are reported in Table 3. The f values in
da
dt 1⁄4 DC*f correlation agree well with the RCC-MR-
A16 [18] data. It is also seen that C* produces the least
scatter when correlating the measured data. A limited
examination of the effect of temperature was undertaken
and it was observed that for a given value of correlating
parameter the crack propagation rate (daydt) was higher at
higher temperature.
3.3 Finite element simulations
This section aims at estimating numerically the crack mouth opening displacement rate history for a propagating crack.
Hence, the crack growth is not simulated but imposed as a boundary condition in the FE analysis. In other words, the crack mouth opening displacement is a result of the inves- tigation. Its history is to be compared with the experimental data. To achieve this goal, finite element computations with node release technique [19] have been carried out on the same geometry and material as the experimental work. The specimen was of the CT geometry (W 1⁄4 45 mm and thick- ness (B) 1⁄4 10 mm) and T 1⁄4 625C. The analysis used elastic plus creep deformation behaviour. The elastic and deforma- tion data used are given in Table 4. The finite element model used was 2D plane stress full specimen geometry. The specimen model with elements is shown in Figure 8a for the case of ayW value of 0.46. The mesh used for the analysis consists of 20536 four-noded elements where an extremely dense mesh was generated around the crack tip area as shown in Figure 8b. A load of P 1⁄4 5 kN was applied to a rigid pin constructed to fit the hole as shown in the mesh whereas the crack growth is numerically imposed by gradu- ally releasing the nodes in the remaining ligament following a(t) in Figure 3. Figure 9 shows the contour plots of the effective creep strain during loading. The deformed specimen (at the end of the crack mouth opening displace- ment simulation) is depicted in Figures 10. As a result, both simulated and experimental total load-line displacement histories are plotted in Figure 11. The difference between the experimental and simulated methods can be attributed to the pre-cracking effect in the former case. Finally, the node release technique used to simulate the creep crack mouth opening displacement history under propagating crack provides good results.
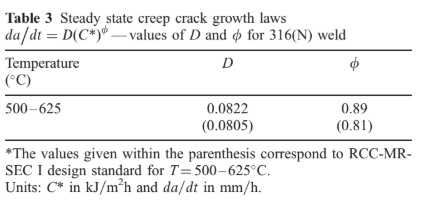
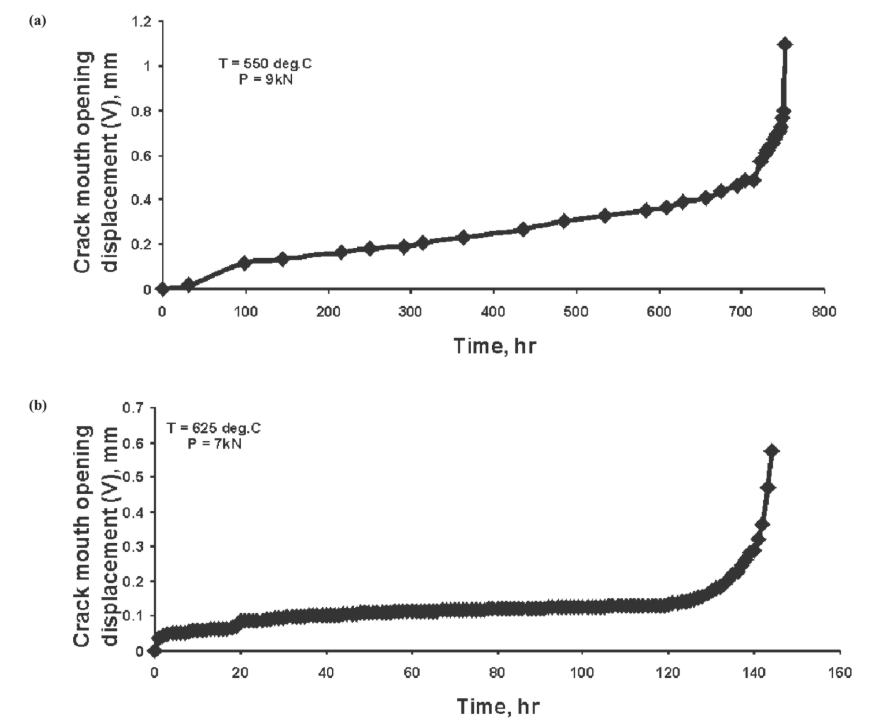
Figure 4 Typical curves showing load line displacement with time: at (a) T 1⁄4 550C; (b) T 1⁄4 625C.
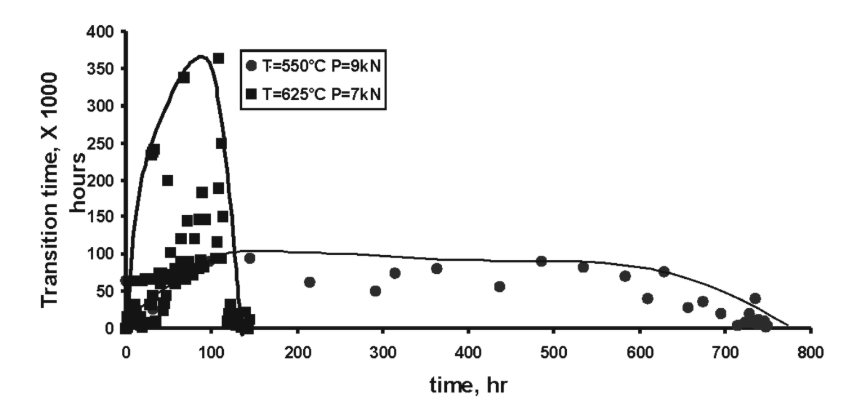
Figure 5 Determination of maximum transition time, tT .
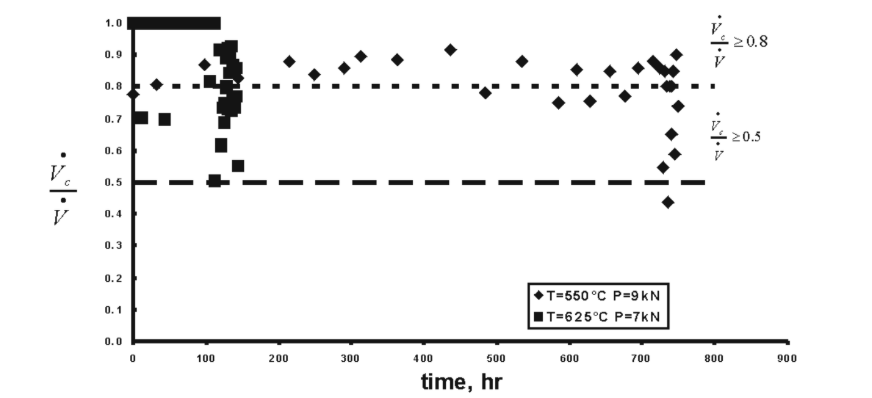
Figure 6 Rate ratio criterion.
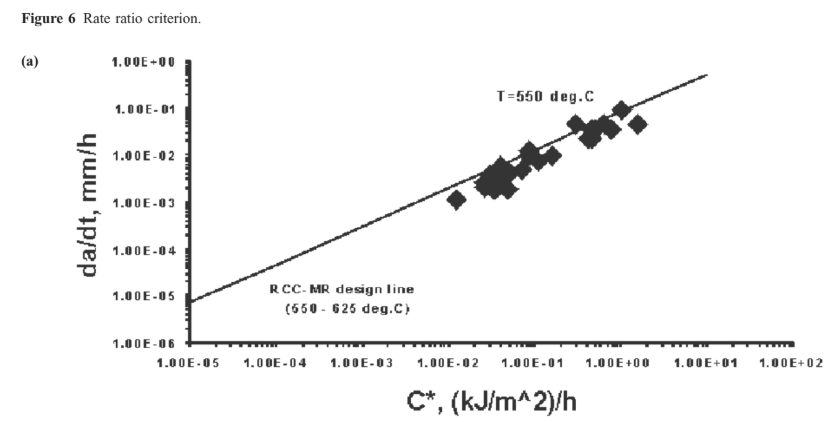
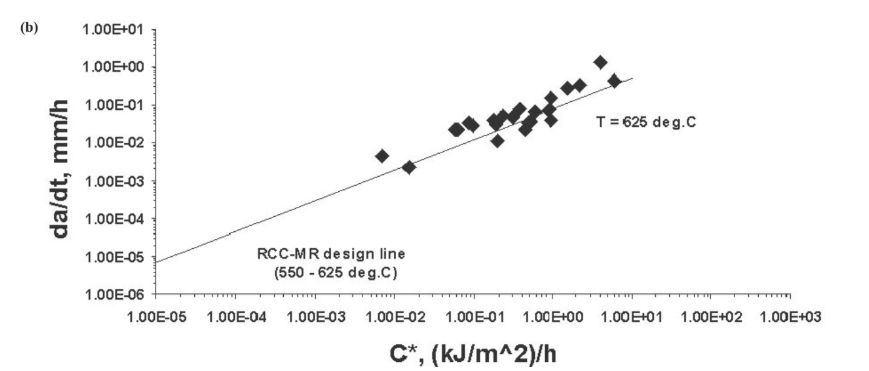
Figure 7 Crack growth rates versus C*: at (a) T 1⁄4 550C; (b) T 1⁄4 625C.
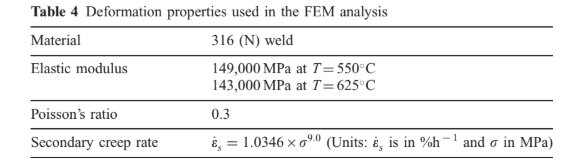
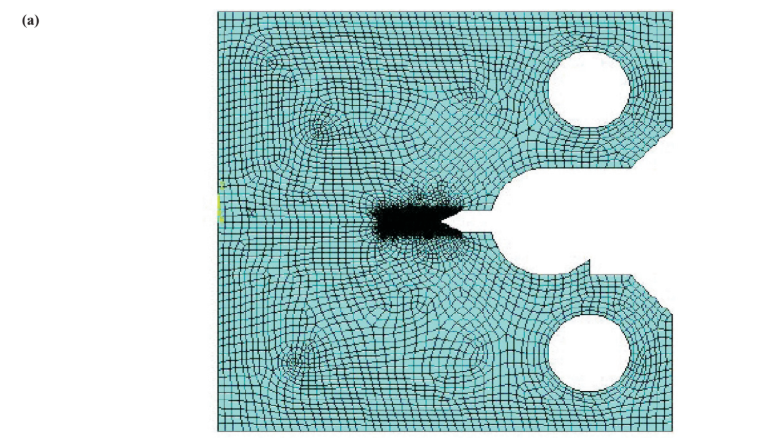
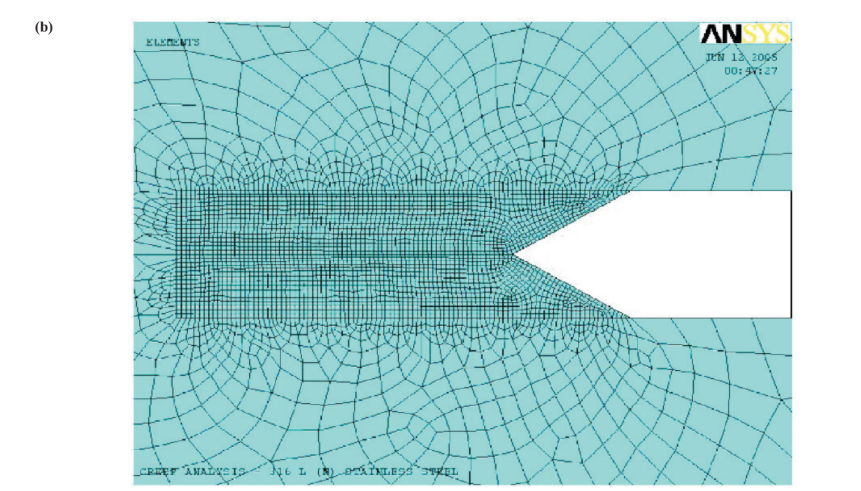
Figure 8 The finite element mesh used for the analysis: (a) the whole mesh; (b) refined mesh around the crack tip area.
Figure 8 The finite element mesh used for the analysis: (a) the whole mesh; (b) refined mesh around the crack tip area.
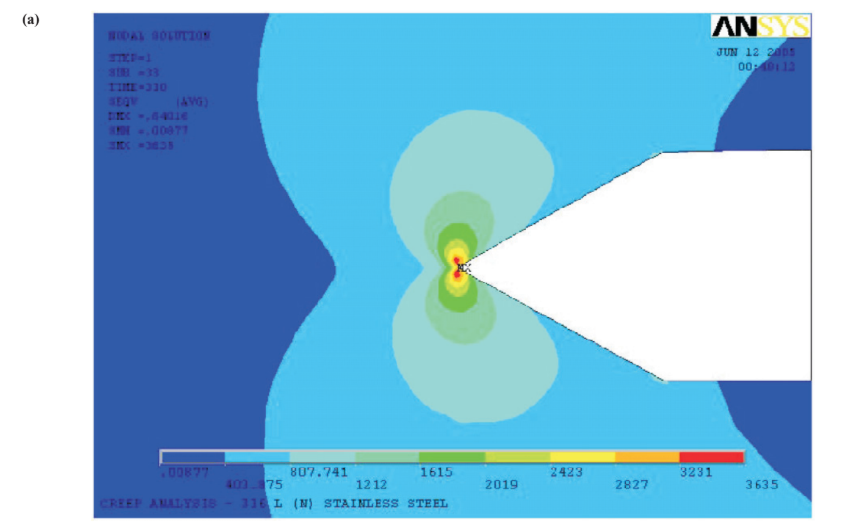
Figure 9 The evolution of the creep zone during the crack growth.
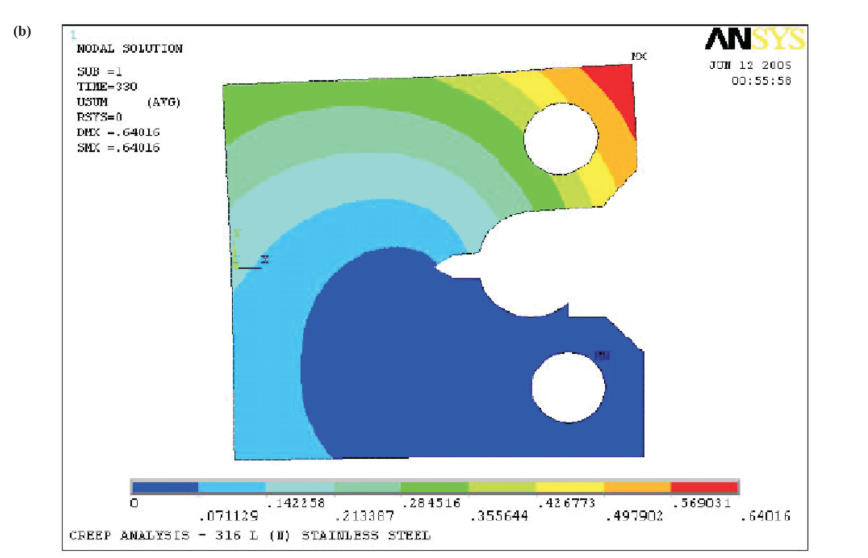
Figure 10 Deformed specimen after t 1⁄4 330 hours.
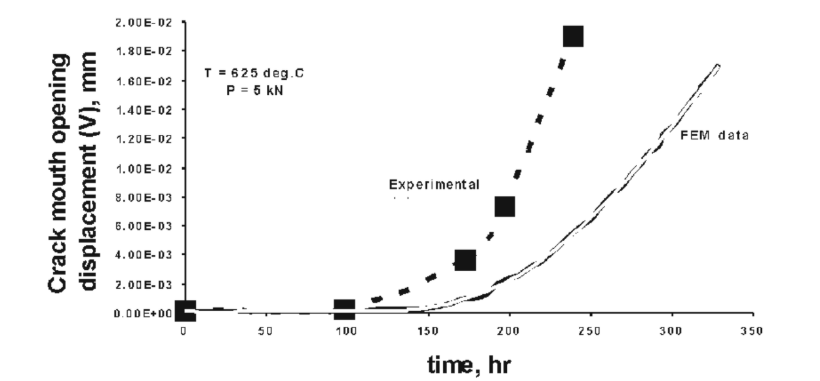
Figure 11 Comparison between experimental and simulated total load-line displacement.
4. CONCLUSION
It has been shown that creep crack growth rates follow a typical two-stage behaviour consisting of initiationyincuba- incubation and a steady cracking period in welds. The parameter C* is used to predict the transition and the crack growth stages. A numerical study of creep deformation behaviour was conducted to calculate the crack mouth opening displacement rate using the node release technique and compared with the experimental results. There is a good agreement between the numerical simulation and experi- mental results. The creep crack growth rate in type 316 (N) stainless steel weld at T 1⁄4 550 and 625C may be controlled by the C* integral.
ACKNOWLEDGEMENTS
The support received from Dr. Baldev Raj, Director, IGCAR, Kalpakkam is gratefully acknowledged. We would like to thank Dr. P. Chellapandi, Associate Director, Nuclear Engineering Group, IGCAR for useful discussions. The ANSYS simulation part of this work was done at NIT as a part of Amaldhasan’s M. Tech thesis.
REFERENCES
[1] Mannan, S.L. and Valsan, M. Low cycle fatigue behaviour of 316L(N) austenitic stainless steel base metal, weld metal and weld joint. Proceedings of third workshop on creep, fatigue and creep-fatigue interaction, Indira Gandhi Centre for Atomic Research, Kalpakkam, January 20 – 22, p. 1 – 132 (1999).
[2] Nikbin, K.M. and Radon, J.C. Meso-fracture of creep crack initiation and growth of engineering materials. Theor. Appl. Fract. Mech., 26, 41 – 45 (1997).
[3] Sadananda, K. and Shahinian, P. Review of fracture mechanics approach to creep crack growth in structural solids. Engng. Fract. Mech., 15, 327 – 342 (1981).
[4] Saxana, A. Creep crack growth under non-steady state condi- tion In: Fracture Mechanics, 17th conf. ASTM STP 905, Vol. 17, pp. 185 – 201 ASTM, Philadelphia, PA (1986).
[5] Nikbin, K.M., Smith, D.J. and Webster, G.A. An engineering approach to the prediction of creep crack growth, J. Engng. Mater. Technol. Am. Soc. Mech. Engrs., 108, 186 – 191 (1986).
[6] Piques, R., Bensussan, Ph. and Pineau, A. Crack initiation and growth under creep and fatigue loading of an austenitic stainless steel. Nucl. Engng. Design, 116, 293 – 306 (1989).
[7] Molinie, E., Piques, R. and Pineau, A. Behaviour of a 1CrMO1 4 V steel after long-term exposure-II. Creep crack initiation and creep crack growth. Fatigue Fract. Engng. Mater. Struct., 14, 547 – 563 (1991).
[8] Piques, R., Molinie, E. and Pineau, A. Comparison between two assessment methods for defects in the creep range. Fatigue Fract. Engng. Mater. Struct., 14, 871 – 885 (1991).
[9] ASTM E 1457-00. Standard test method for measurement of creep crack growth rates in metals, ASTM, Philadelphia, PA 19103, USA (2000).
[10] Landes, J.D. and Begley, J.A. In: Mechanics of crack growth, pp. 128 – 148. ASTM STP 590 American Society for Testing and Materials (1976).
[11] Tan, M., Celard, N.L.C., Nikbin, K.M. and Webster, G.A. Comparison of creep crack initiation and growth in four steels tested in HIDA. Int. J. Press. Vess. Pip., 78, 737 – 747 (2001).
[12] RCC-MR-SEC I. Design and construction rules for mechan- ical components of FBR nuclear islands. Subsection Z, Proper- ties group 1S, AFCEN (2002).
[13] Austin, T.S.P. and Webster, G.A. Prediction of creep crack growth incubation periods. Fatigue Fract. Engng. Mater. Struct., 15 (11), 1081 – 90 (1992).
[14] RCC-MR-SEC IV. Design and construction rules for mechan- ical components of FBR nuclear islands, Section IV, Subsec- tion RS 3000, AFCEN (2002).
[15] ASME Boiler and Pressure vessel code, Section IX; (1998).
[16] Riedel, H. Creep deformation at crack tips in elastic-visco plastic solids. J. Mech. Phys. Solids, 29, 35 – 49 (1981).
[17] Maas, E. and Pineau, A. Creep crack growth behaviour of type 316L steel. Engng. Fract. Mech., 22, 307 – 335 (1985).
[18] RCC-MR-SEC I Design and construction rules for mechanical components of FBR nuclear islands, Section I, Subsection Z, Technical appendix A16 (2002).
[19] Besson, J. and Foerch, R. Large scale object-oriented finite element code design. Computat. Meth. Appl. Mech. Engng., 142, 165 – 87 (1997).